[Bitop Review] Technical Analysis:BTC、ETH、SOL
2025年04月29日发布
BTC

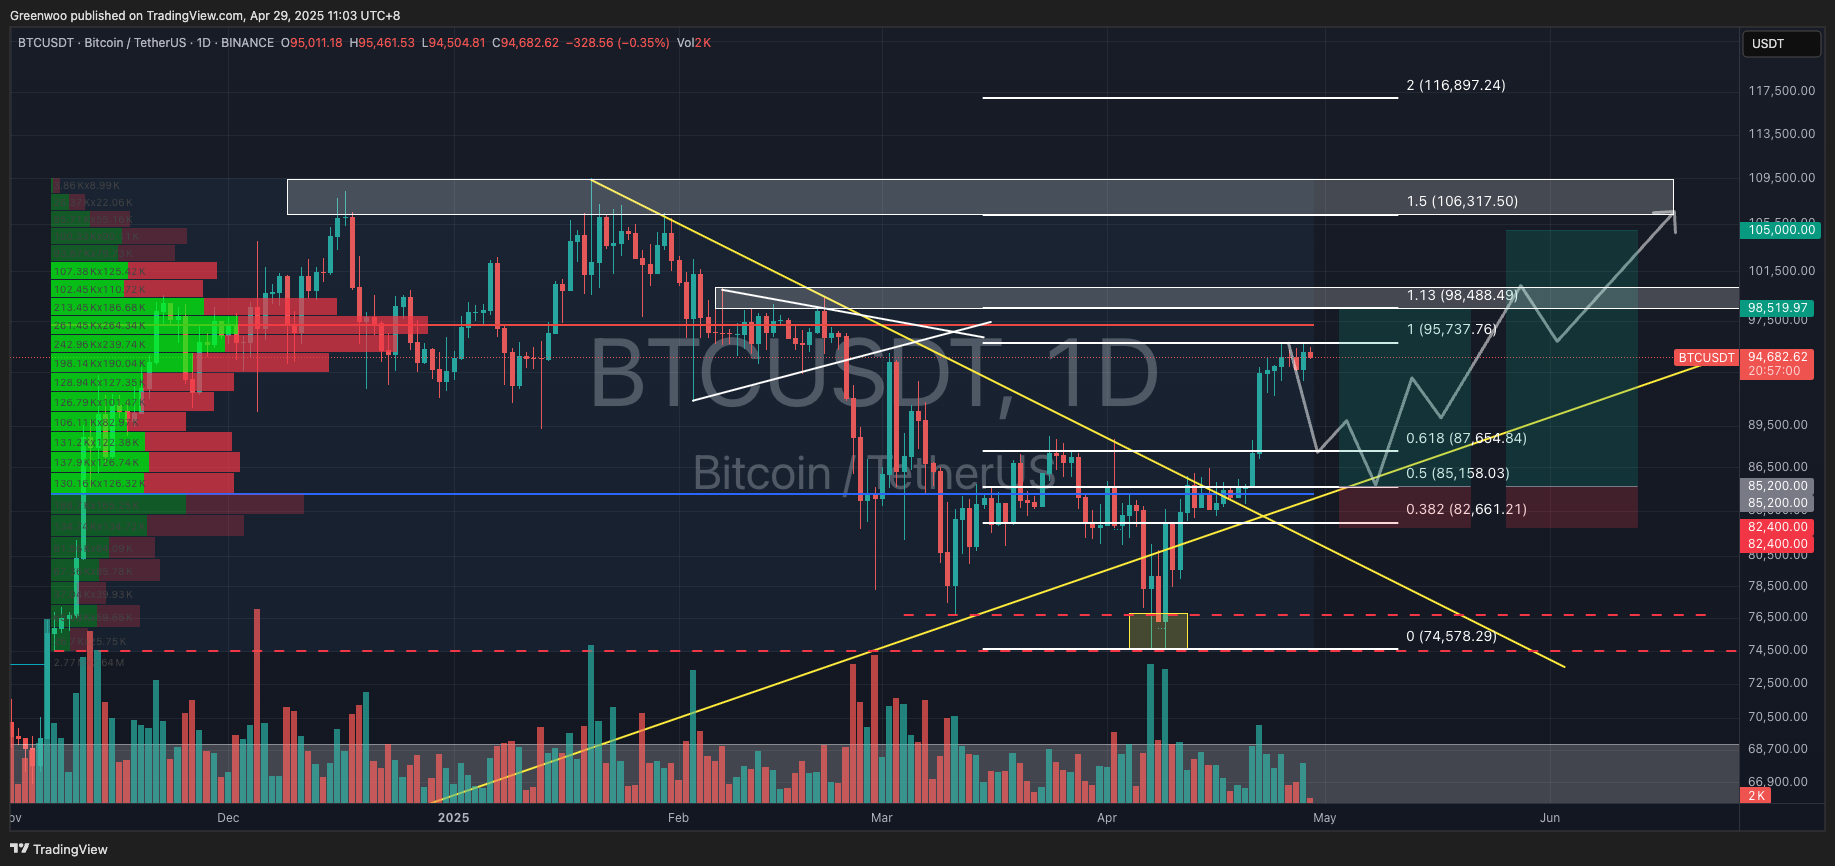
Since the 22nd, BTC's upward momentum has slowed. After briefly breaking above $95K on the 25th, the price entered a consolidation phase, currently at $94,560 as of writing. The yellow trendline, drawn since September 2023, provided strong support at $74.5K after a false breakdown, followed by a breakout above a triangle pattern, indicating relatively strong bullish momentum.
Recently, the price has struggled to break the $95K resistance, suggesting weakening bullish strength. The author speculates a short-term pullback, with support likely around $85K. This level aligns with the Fibonacci 0.5, a high-volume trading zone, and the long-term trendline, enhancing its reliability as a support area. Investors who missed the prior rally may consider waiting for this pullback to establish long positions.
Reference Levels:
Direction: Long
Entry: $85,000 - $87,650 (Fib 0.5-0.618)
Take Profit: $98,500 / $105,000 (Fib 1.13/1.414-1.5)
Stop Loss: $82,400
ETH

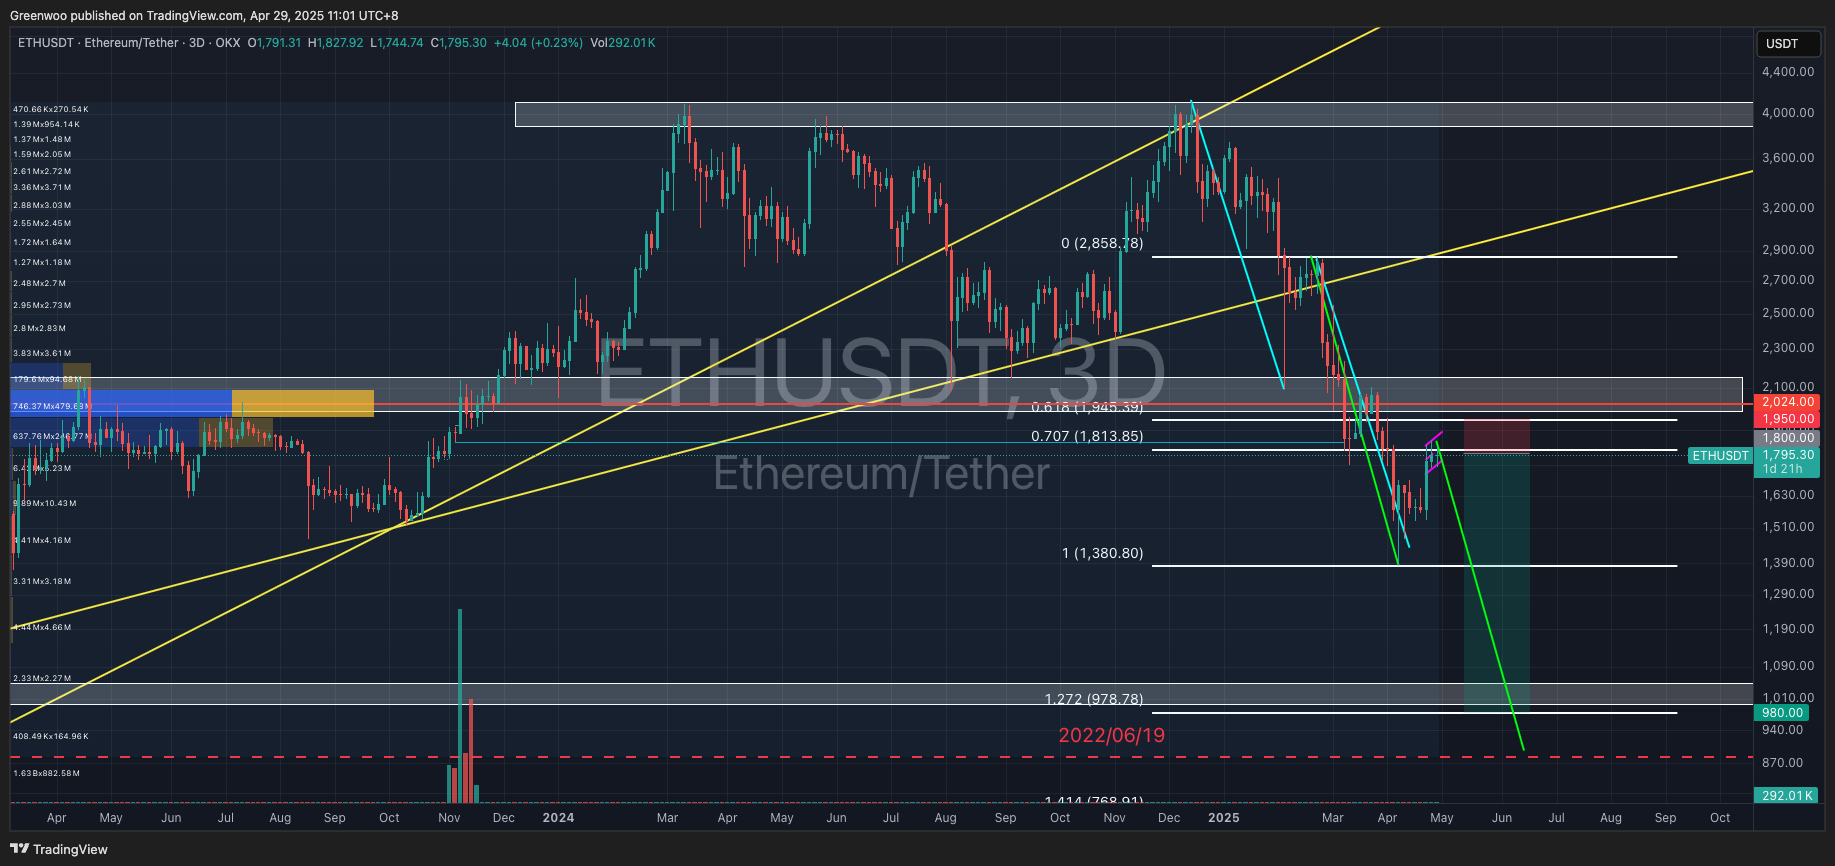
ETH's price action is concerning, having consecutively broken two long-term trendlines—one traceable to 2022 and another to 2020. These breaks reflect declining market confidence. After completing the first leg of a downtrend (blue line) and dropping to $1,380, the price has slowly recovered to $1,800 as of writing. A small flag pattern (purple channel) has formed, potentially a continuation pattern that could break upward.
However, given ETH's recent poor performance, the author doubts an upward rebound. Instead, investors may consider shorting at the current market price or after the price touches the upper flag boundary or breaks below the flag. Based on pattern analysis, the take-profit level is estimated around $900, slightly above the previous low of $880.
Reference Levels:
Direction: Short
Entry: $1,800 (market price)
Take Profit: $980
Stop Loss: $880 - $980 (previous low – Fib 1.272)
SOL

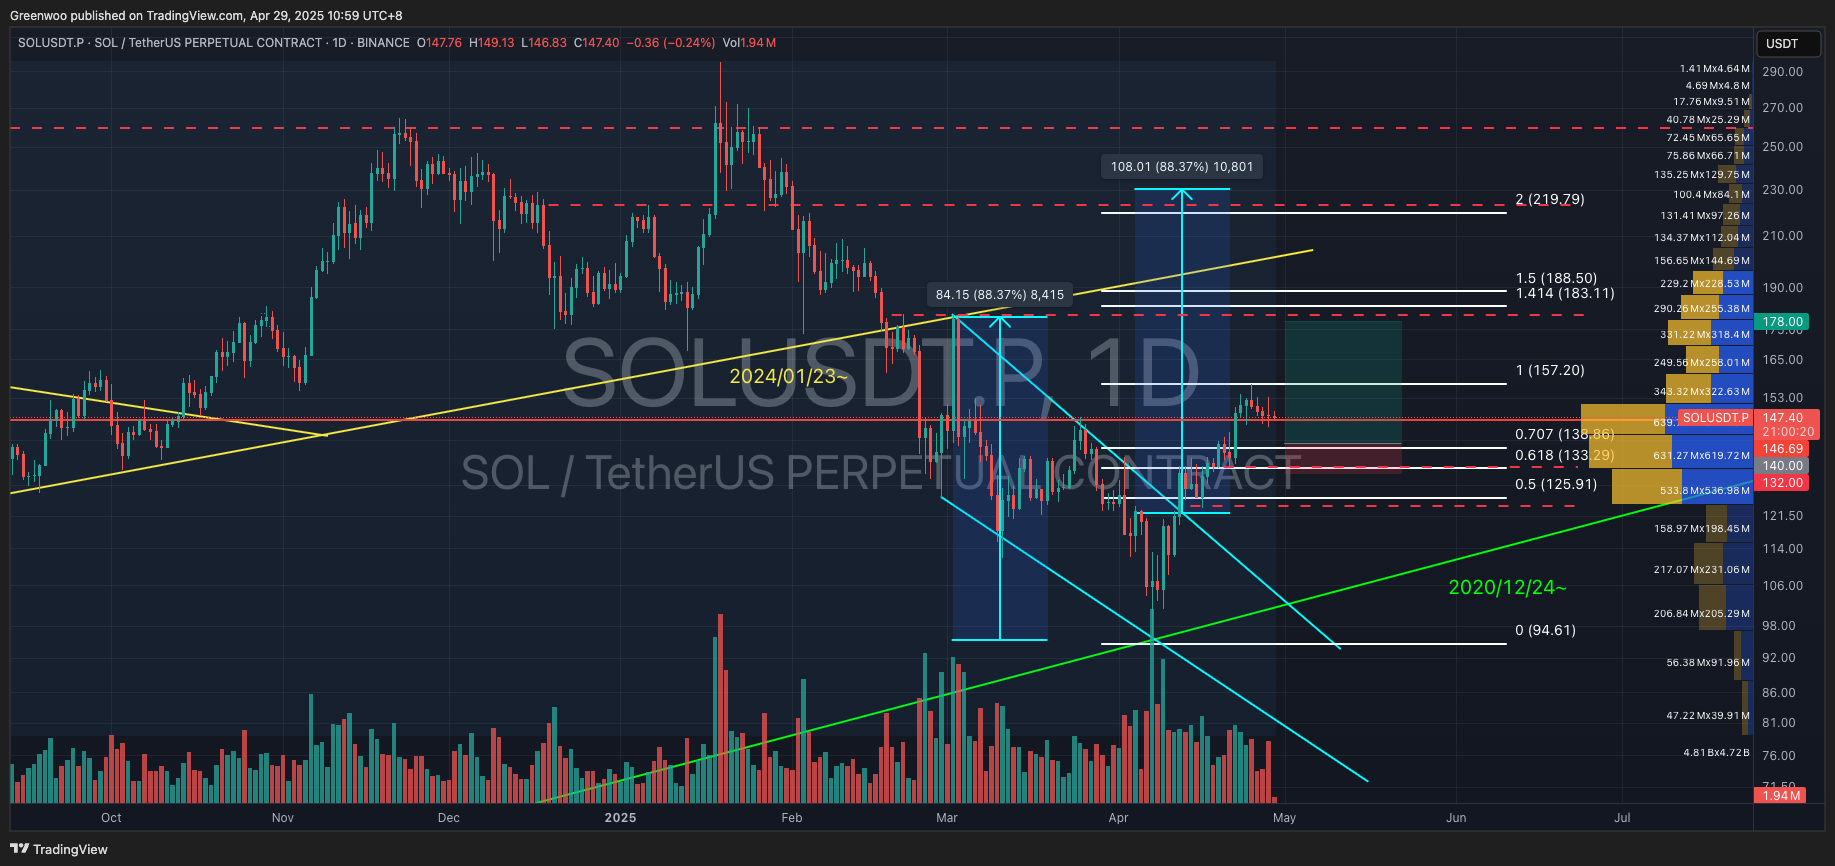
SOL's performance contrasts sharply with ETH. Although it broke below the trendline from January 2024 (yellow line), it found support at the long-term trendline from 2020 (green line). The price has formed a descending wedge (blue lines), a typical reversal pattern suggesting a potential upward breakout.
The price recently pulled back near $157. Investors may consider establishing long positions between $133 and $140 (Fib 0.618-0.707). Based on the wedge pattern, the target price implies a 60-65% upside. Taking profit near the previous high of $180 offers around a 30% gain.
Reference Levels:
Direction: Long
Entry: $133 - $140 (Fib 0.618-0.707)
Take Profit: $180 / $219 / $260
Stop Loss: $132 (below previous low and Fib 0.618)
Disclaimer: None of the information contained here constitutes an offer (or solicitation of an offer) to buy or sell any currency, product or financial instrument, to make any investment, or to participate in any particular trading strategy.