[Bitop Review] Crypto Analysis: AAVE, SUI, XRP
2025年06月11日发布
AAVE

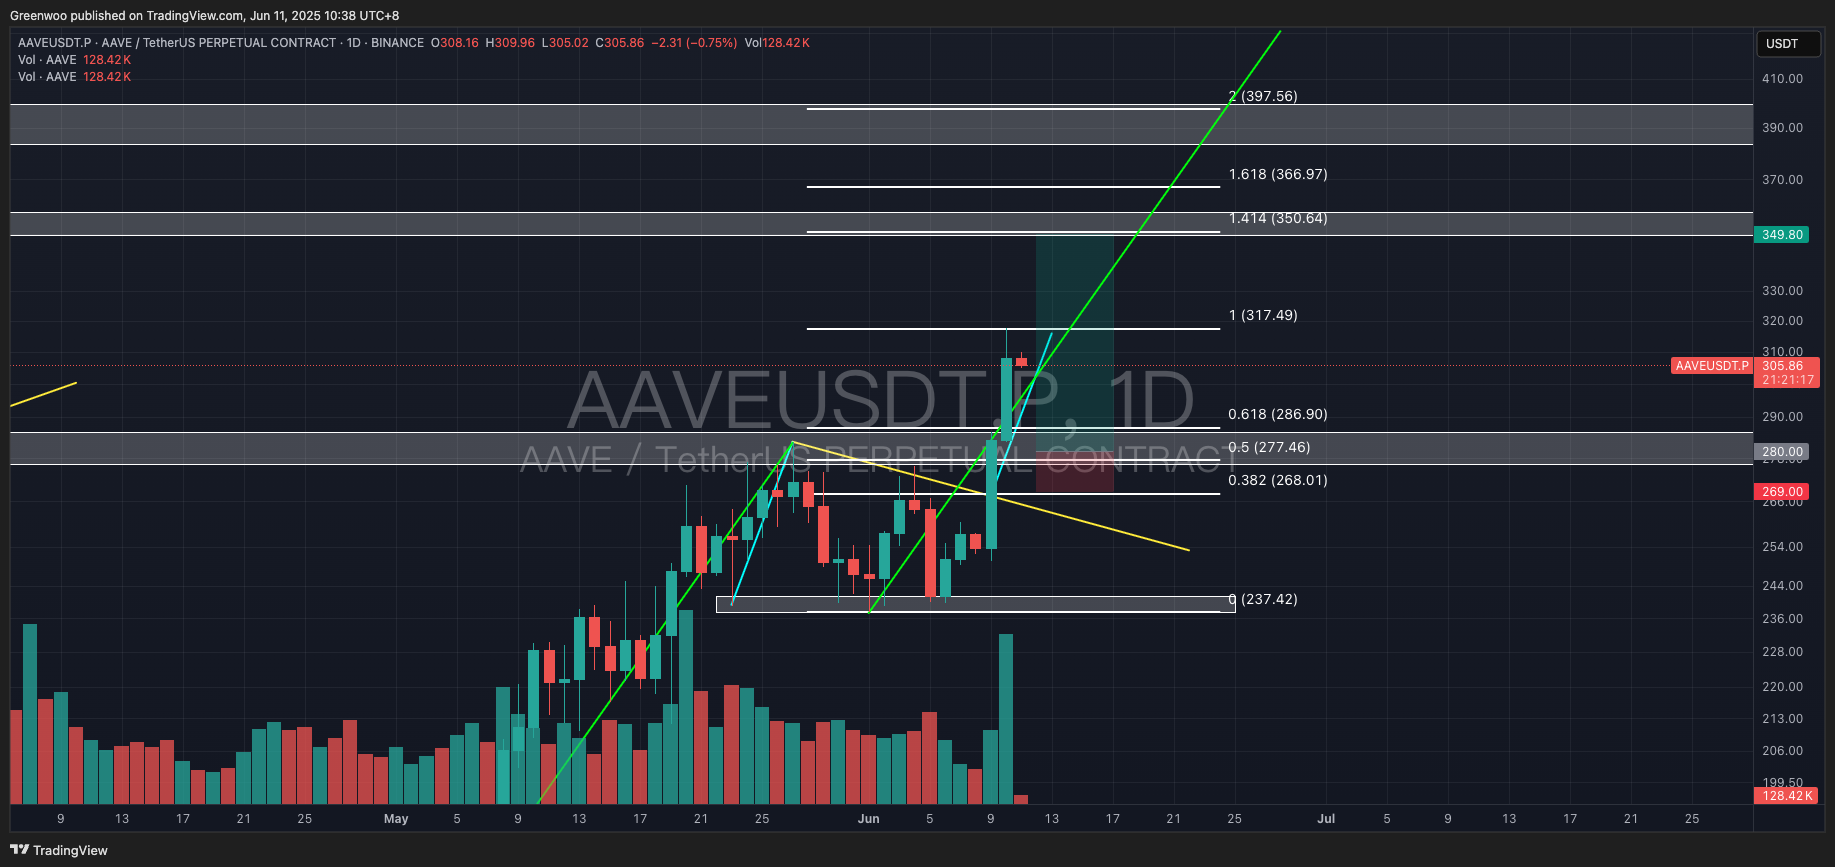
AAVE has performed strongly recently, with two consecutive days of robust gains, reaching up to 25%. The price faced resistance around $317.5 and is expected to pull back to test the support zone. Investors may consider entering long positions near the previous high of $282.8, with entry points between $277.5 and $287, corresponding to the Fibonacci 0.5 to 0.618 levels. Take-profit levels can be set in stages at $320, $350, and $400. Stop-loss levels, depending on individual risk tolerance, can be placed between $268 and $237.
Reference Levels:
Direction: Long
Entry: $280 / $277 - $287
Take Profit: $318 / $350 / $400
Stop Loss: $267.9 / $282 / $237
SUI

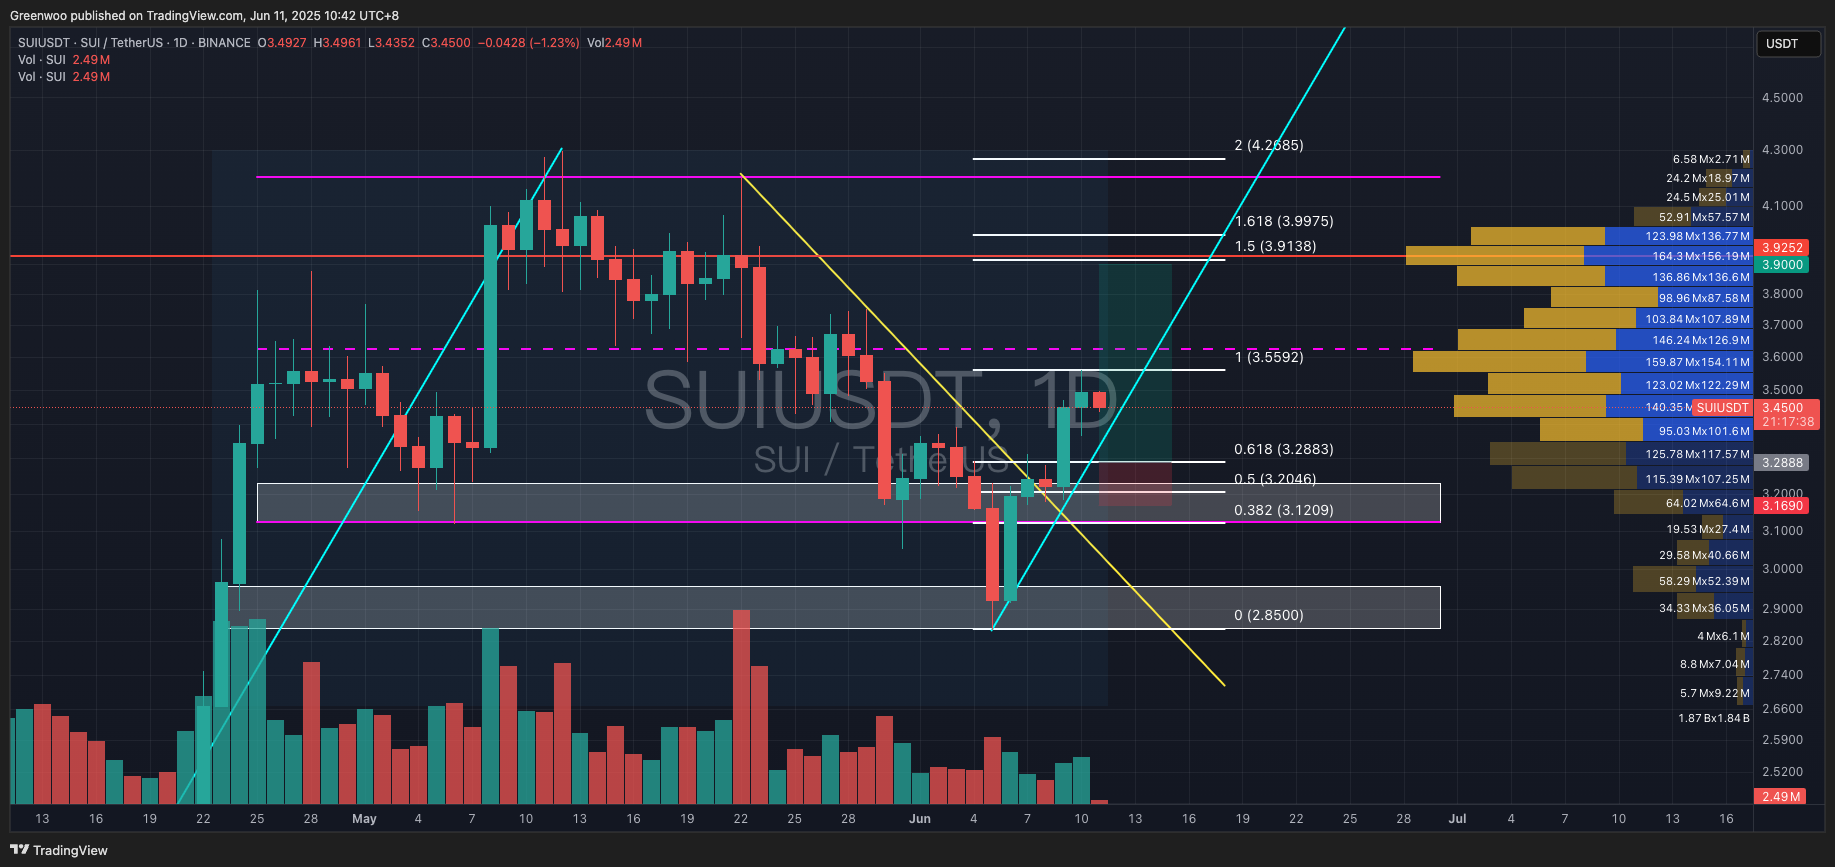
SUI recently broke below its trading range (purple parallel channel) but found support around $2.85, rebounding and rising for about a week. The price faced resistance near $3.56, slightly below the midpoint of the trading range. Given the recent strong rally, the prior breakdown is likely a false breakout. Additionally, the price has broken above a descending trendline (yellow line), suggesting a potential reversal.
The price is expected to pull back to test the support zone, and investors can consider entering long positions between $3.28 and $3.35, with a possible lower entry at $3.2, roughly at the Fibonacci 0.5 level.
Take-profit levels can be set at $3.9, $4.2, and up to $7, though reaching $7 may take time and involve significant volatility, so short-term trading is recommended. Stop-loss levels, based on risk tolerance, can be placed between $3.169 and $2.85.
Reference Levels:
Direction: Long
Entry: $3.2 / $3.28 - $3.35
Take Profit: $3.6 / $3.9 / $4.2 / $7
Stop Loss: $3.169 / $3.119 / $2.849
XRP

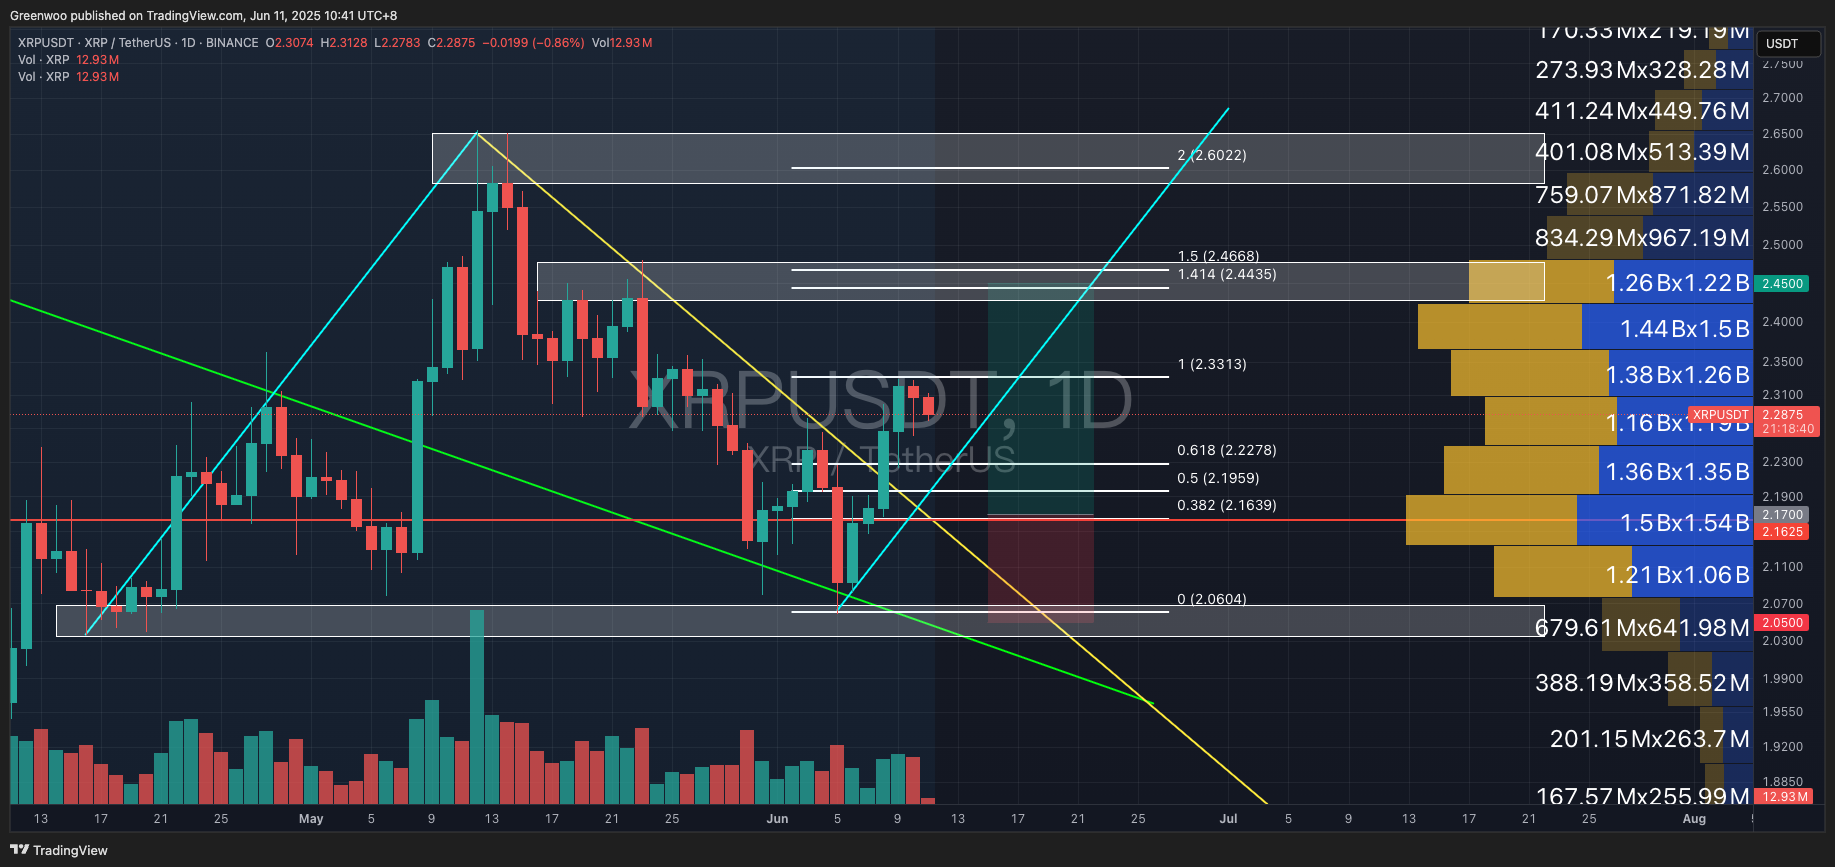
XRP experienced about three weeks of consecutive declines before finding support near the neckline of a head-and-shoulders bottom pattern (green line), close to the right shoulder of the pattern. After about a week of gains, the price broke above a descending trendline (yellow line) but faced resistance around $2.33.
Investors can wait for a pullback to the high-volume trading zone before entering long positions, with entry points between $2.165 and $2.23, corresponding to the Fibonacci 0.382 to 0.618 levels and aligning with the high-volume zone.
Take-profit levels can be set at $2.45 and $2.6 based on prior resistance. Stop-loss levels, depending on risk tolerance, can be placed between $2.14 and $2.34.
Reference Levels:
Direction: Long
Entry: $2.165 - $2.64
Take Profit: $3.45 / $2.6
Stop Loss: $2.46 / $2.35
Disclaimer: None of the information contained here constitutes an offer (or solicitation of an offer) to buy or sell any currency, product or financial instrument, to make any investment, or to participate in any particular trading strategy.