[Bitop Review] Crypto Analysis: BTC, ETH
2025年06月13日发布
BTC

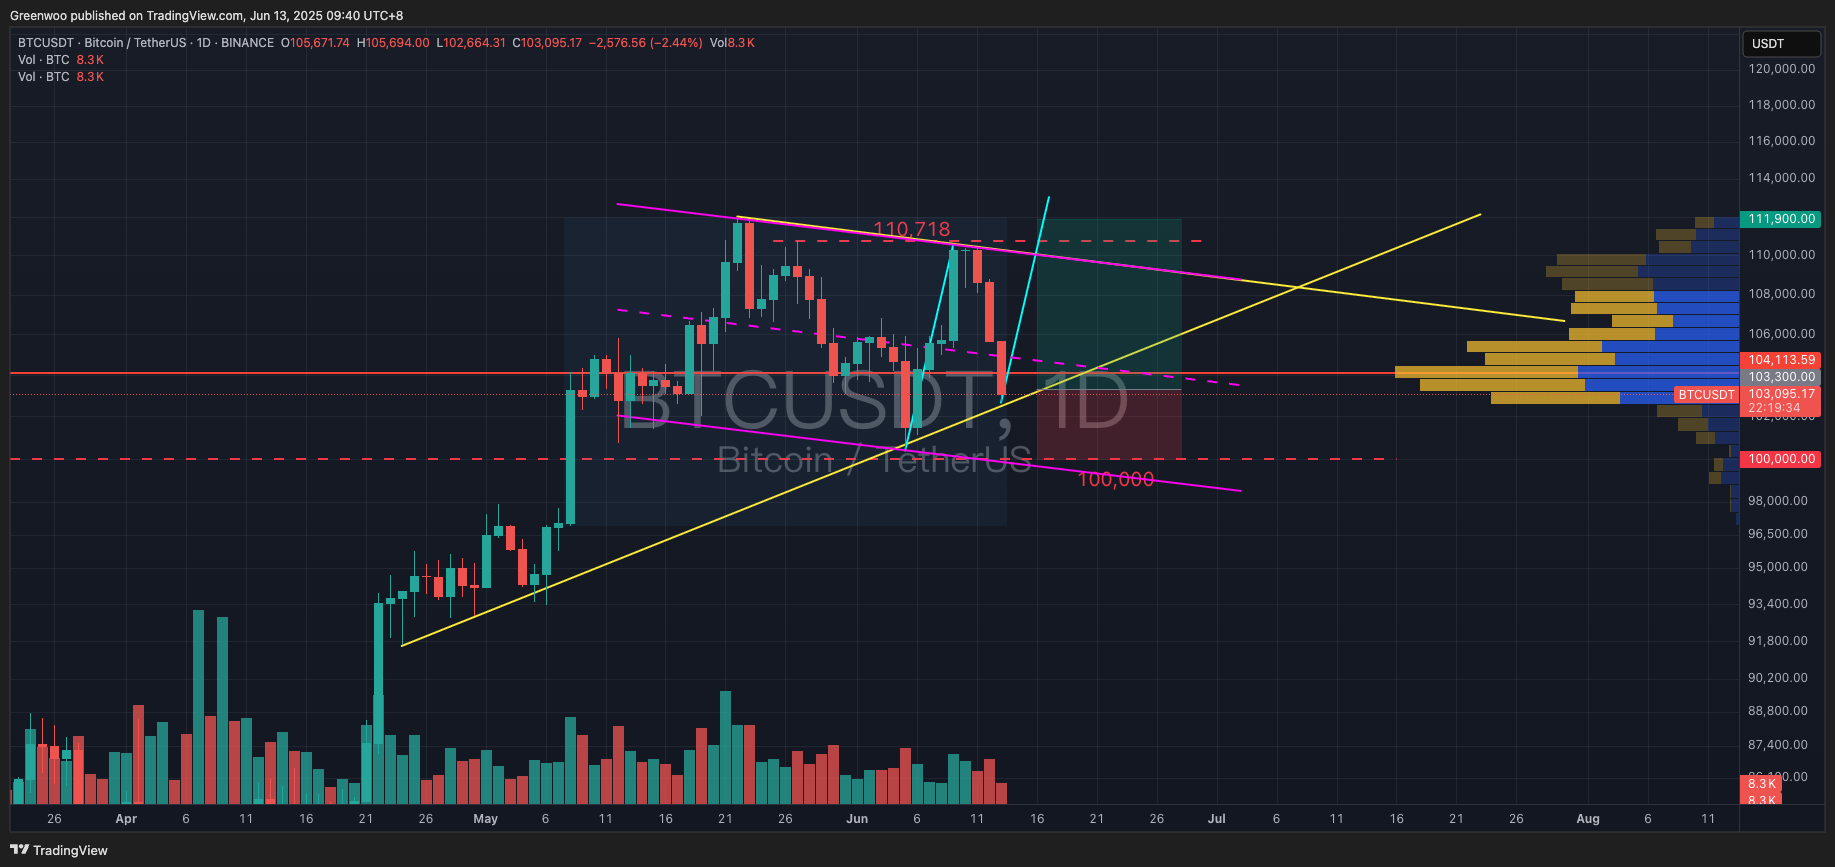
BTC recently failed to break its previous high of $111,780 and has been declining for three consecutive days, finding temporary support at the trendline (yellow line). As of writing, the price is approximately $103,500, down about 4.5% in the past 24 hours.
If the price successfully holds above the trendline, consider entering a long position at market price for short-term trading. Entry range: $102,664 to $104,000. Take-profit levels can be set at $110,718 to $110,980 or $103,000. Stop-loss depends on individual risk tolerance, with options below the previous low of $100,300 or below $100,000.
This is a contrarian left-side strategy. Given recent high volatility, investors should closely monitor price movements and exit immediately if bearish signals appear to avoid significant losses.
Reference Levels:
Direction: Long
Entry: $102,664 - $104,000
Take-Profit: $110,718 - $110,980 / $103,000
Stop-Loss: $100,300 / $99,999
ETH

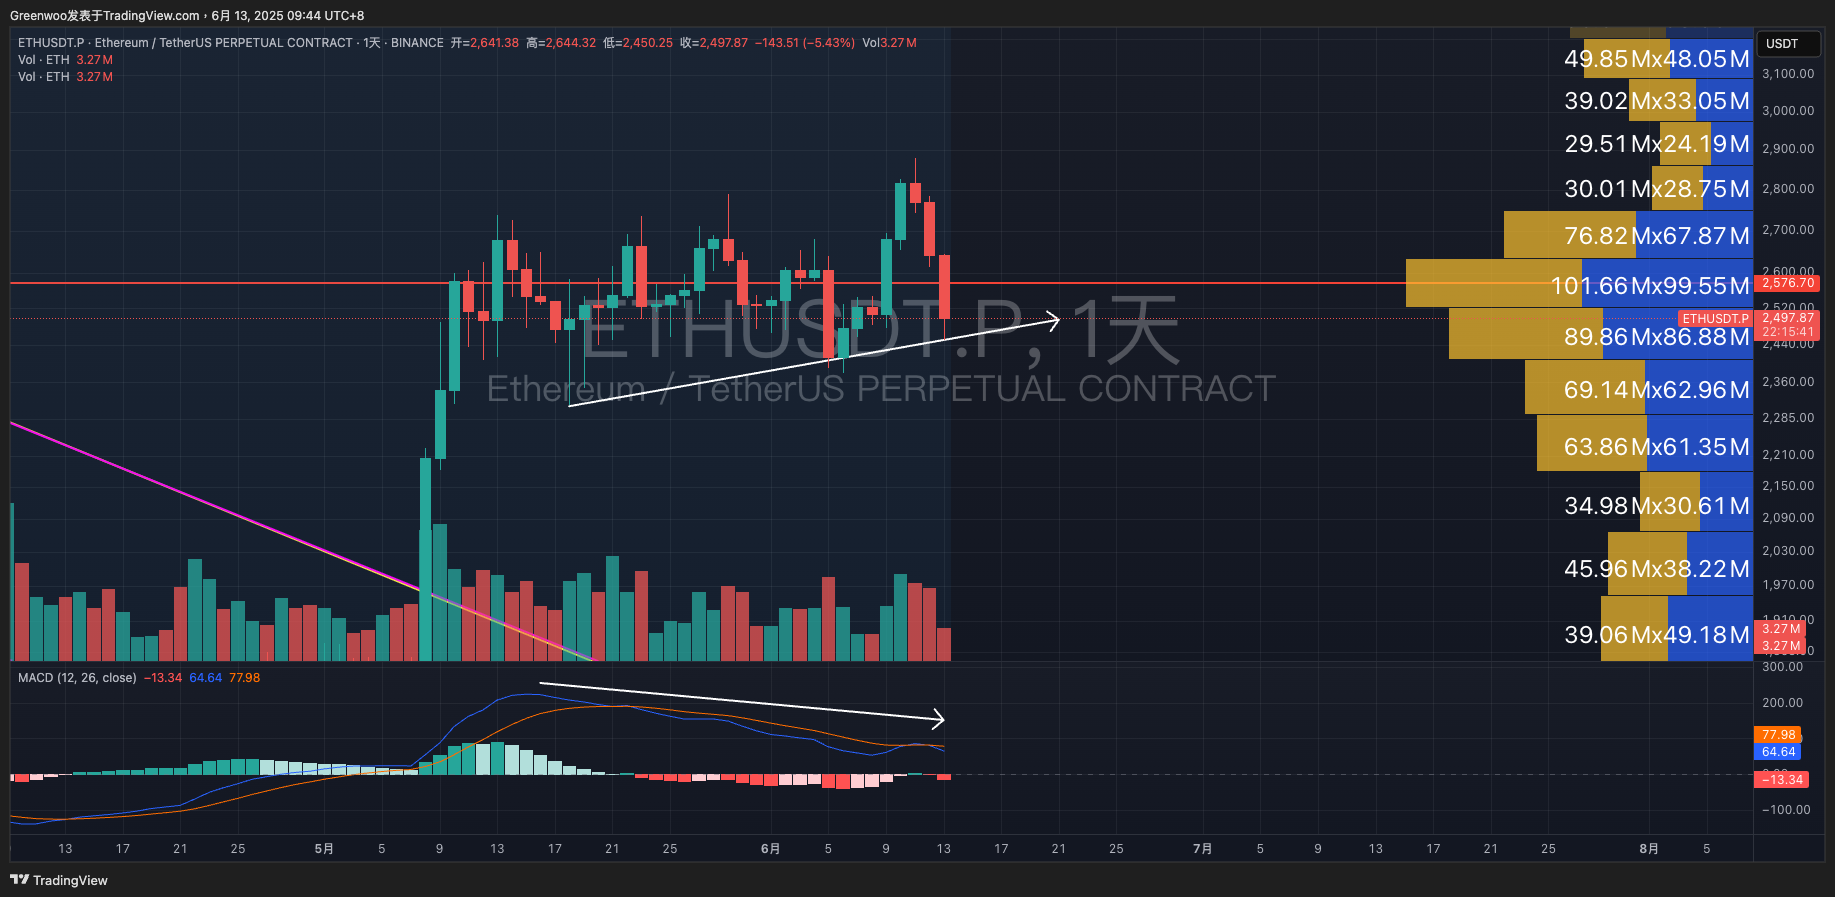
ETH’s price has also followed the broader market decline, finding temporary support at the trendline (white arrow). The price appears to be gradually rising, but the MACD indicator below shows a divergence: while the price increases, the indicator declines, signaling a classic bearish divergence.
For investors looking to trade this asset, wait for the price to decisively break below the trendline to confirm the bearish divergence before entering a short position. The breakdown signal should be based on the closing price, with a minimum drop of 3%. More conservative investors can wait for a 5% drop before shorting.
Disclaimer: None of the information contained here constitutes an offer (or solicitation of an offer) to buy or sell any currency, product or financial instrument, to make any investment, or to participate in any particular trading strategy.