[Bitop Review] AVAX Exploding Upward – Don't Miss W's Flag Pattern Goldmine While A (Formerly EOS) Tanks!
2025年09月11日发布
A(Formerly EOS)

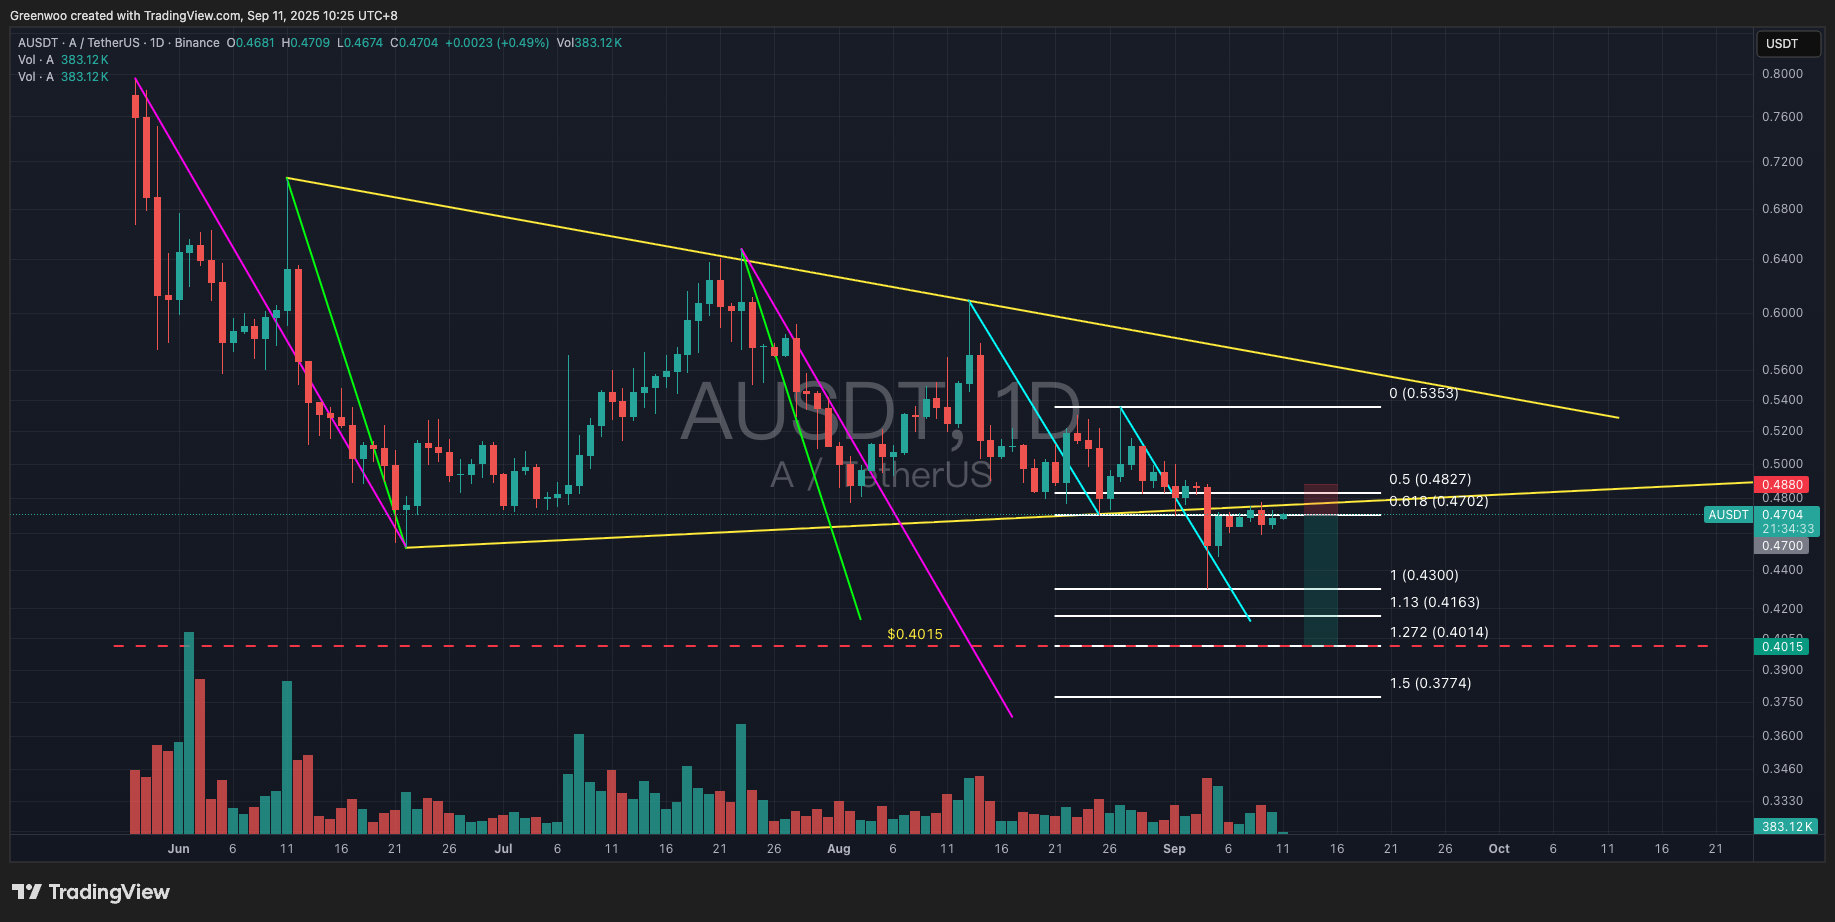
EOS, also known as the grapefruit coin, was renamed to A (Vaulta) starting from May 28, but the name change has not altered its originally sluggish trend. Recently, the price broke below the triangle pattern and found support at 0.43 USD, rebounding before facing resistance again at 0.4777 USD. The resistance level is between the Fibonacci 0.5 and 0.618, approximately equivalent to the lower edge of the triangle, which is a normal retest.
As of the time of writing, the price is temporarily at 0.47 USD. Investors can take this opportunity to enter a short position. Take-profit targets can be set in batches at 0.43, 0.4165, and 0.4015 USD. Among them, 0.4015 USD is EOS's historical low and also the Fibonacci 1.272 level. The stop-loss can be placed above the September 4 high of 0.4877 USD.
Reference Points:
Direction: Short
Entry: $0.47 (Market Price)
Take Profit: $0.43 / $0.4165 / $0.4015
Stop Loss: $0.488
AVAX

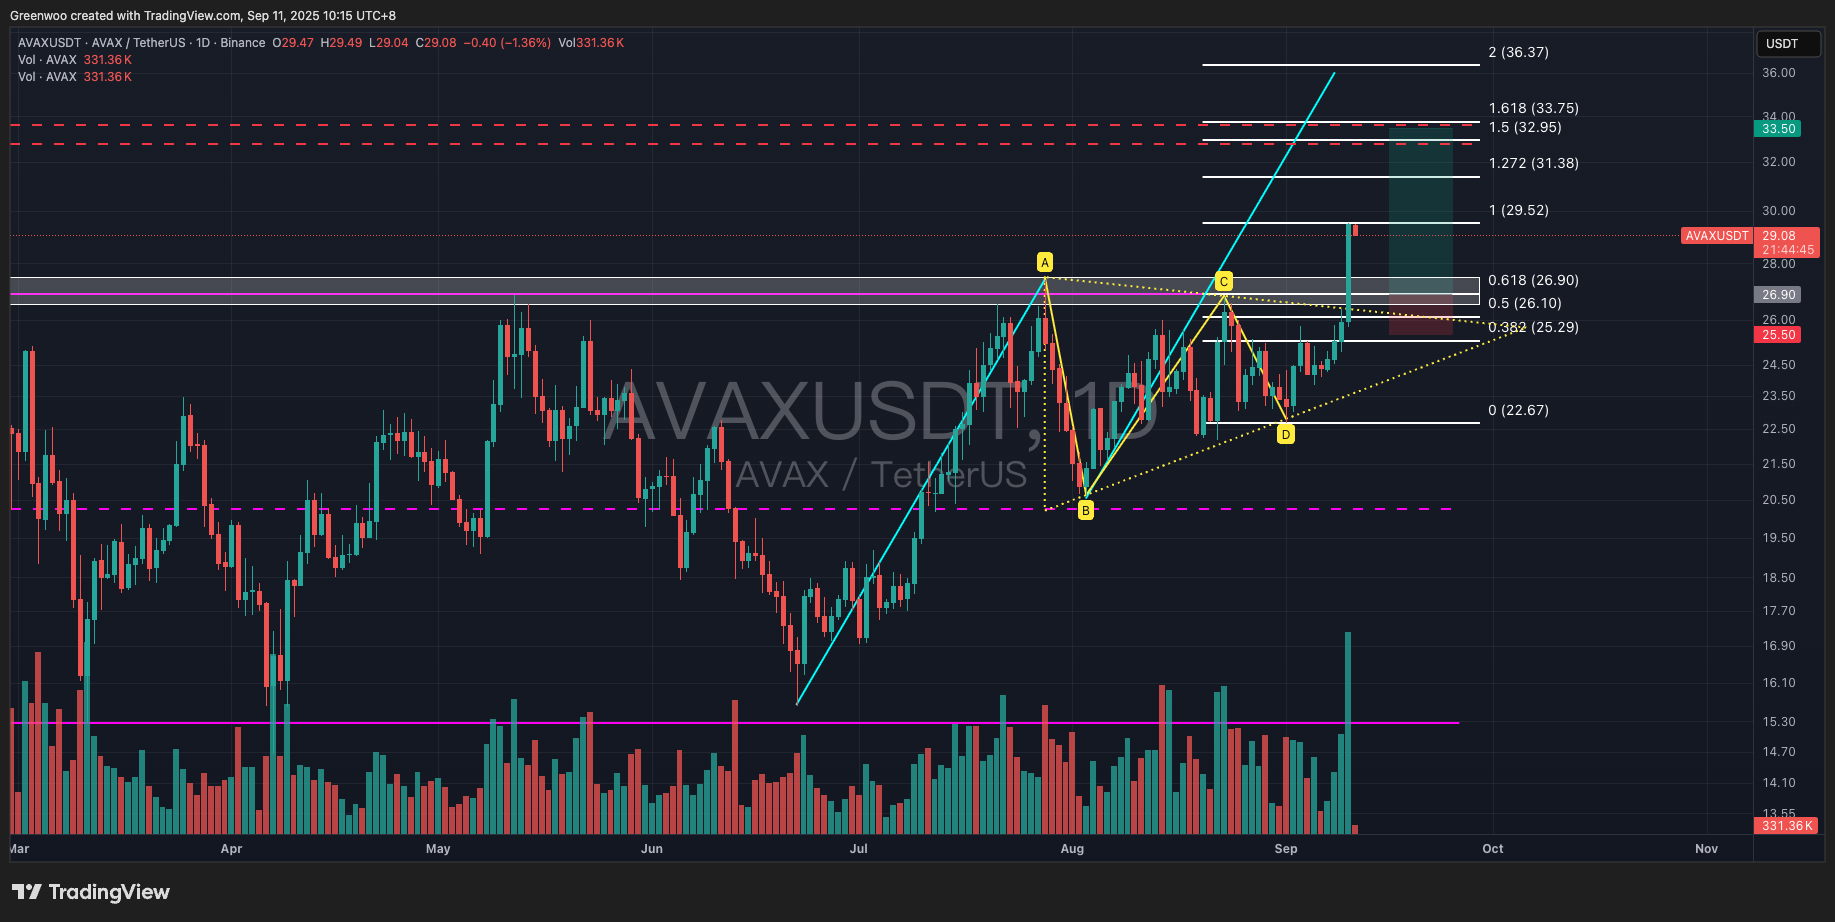
AVAX broke out of a large trading range with volume yesterday and temporarily faced resistance at 29.52 USD. It closed at 29.48 USD yesterday, with a single-day gain of 13.69%. As of the time of writing, the price is temporarily at 28.87 USD, with a current decline of 2.07% today. The price may retest the support range, which is around the upper edge of the trading range at about 27 USD. This level coincides with the Fibonacci 0.618, providing some support strength.
This upward move also broke through the triangle pattern, and the price may retest the upper edge of the triangle at 26.1 USD (approximately the Fibonacci 0.5). Investors can place limit orders to enter long positions between 26.1 and 27 USD. Take-profit targets can be set in batches at 31.38, 32.95, and 33.75 USD. The stop-loss should be based on personal risk tolerance, ranging between 25.5 and 24.9 USD.
Reference Points:
Direction: Long
Entry: $26.1 - $27
Take Profit: $31.38 / $32.95 / $33.75
Stop Loss: $25.5 - $24.9
W

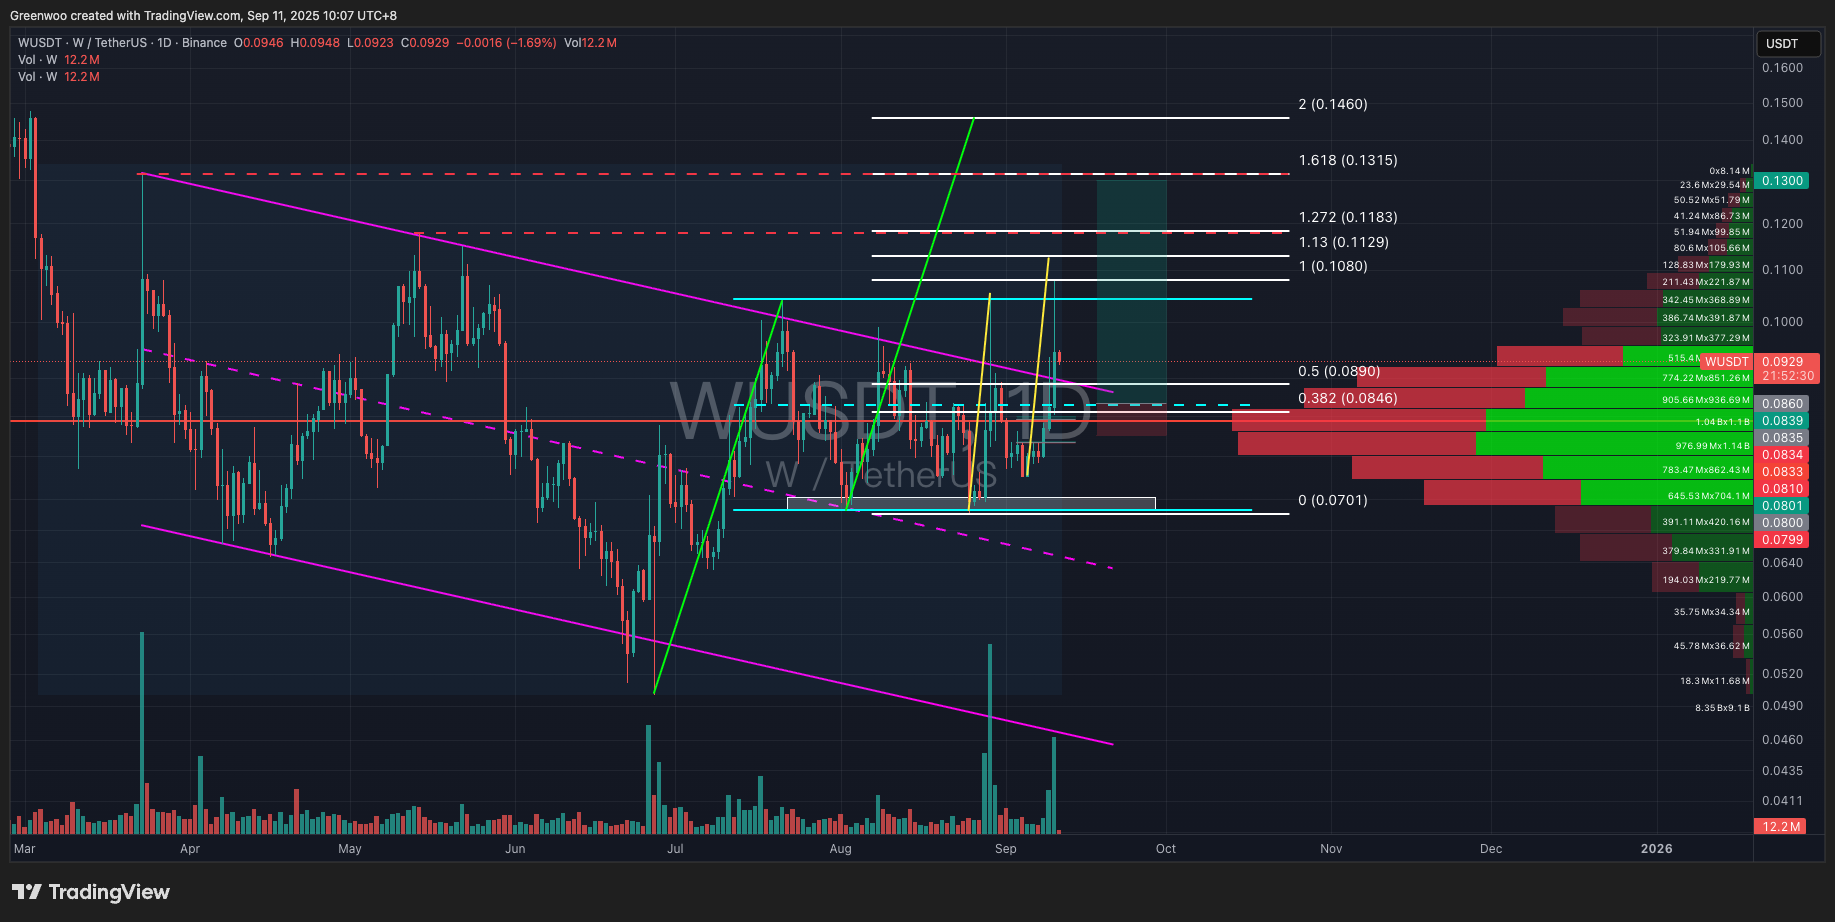
The price of W broke out of the descending channel with volume on August 29 and faced resistance at 0.1053 USD before pulling back. After consolidating for about two weeks, it broke out again with volume yesterday, but faced resistance at 0.108 USD and pulled back once more. Both breakouts showed price increases with rising volume, which can be considered valid breakouts. Moreover, both rallies surpassed previous highs, and the pullbacks did not break previous lows, indicating that the trend is shifting to an upward one.
The price is currently forming a flag pattern, suggesting the trend may continue. Investors can observe the price reaction when it falls to the midpoint of the blue flag pattern, around 0.085 USD. This level is approximately equivalent to a high-volume trading zone and overlaps with the Fibonacci 0.382. If the price successfully holds steady, one can enter a long position. Take-profit targets can be set in batches at 0.113, 0.118, and 0.13 USD. The stop-loss can be placed below 0.081 USD.
Although recent rallies have shown price increases with rising volume, the candlesticks all feature long upper shadows, indicating potentially heavy selling pressure above. Investors entering positions should closely monitor the price reaction at upper resistance levels and take profits in a timely manner while adjusting the stop-loss to above the entry point.
Reference Points:
Direction: Long
Entry: $0.085 - $0.086
Take Profit: $0.113 / $0.118 / $0.13
Stop Loss: $0.081
Disclaimer: None of the information contained here constitutes an offer (or solicitation of an offer) to buy or sell any currency, product or financial instrument, to make any investment, or to participate in any particular trading strategy.